DH Project Reflection

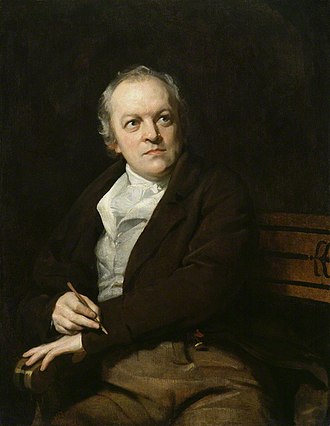
For this course my partner and I aimed to examine and research William Blake, an English poet, painter and printmaker, a person who wasn’t recognized for all his works during his life. Blake is a Romantic poet who was also famous for his illustrations. We chose to discuss Blake’s work because his views on religion and life are very interesting and present in his works from The Marriage of Heaven and Hell as well as Milton, but most importantly his work was grown into the minds of all the following successors that revived and where inspired by contribution to the romantic movement.

William Blake

The main goal of our project was to find the main theme in Blake’s work. Other questions we asked ourselves were: Did anyone from his family influence his work? Why was Blake’s work only relived after his death? Who did he inspire after his death?

We managed to achieve the goal of finding the main theme of his work, and we also discovered that his parents encouraged him to lead an artistic life. However, we did not focus on why his work was not recognized during his lifetime. Our project scope changed to focus more on the theme of his poems and novels, rather than expand on Blake himself as a person and why he was not famous when he lived.

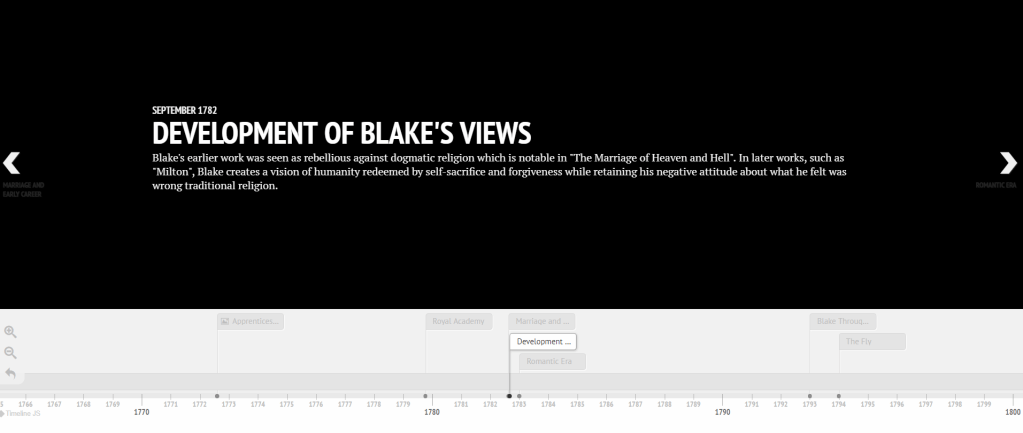
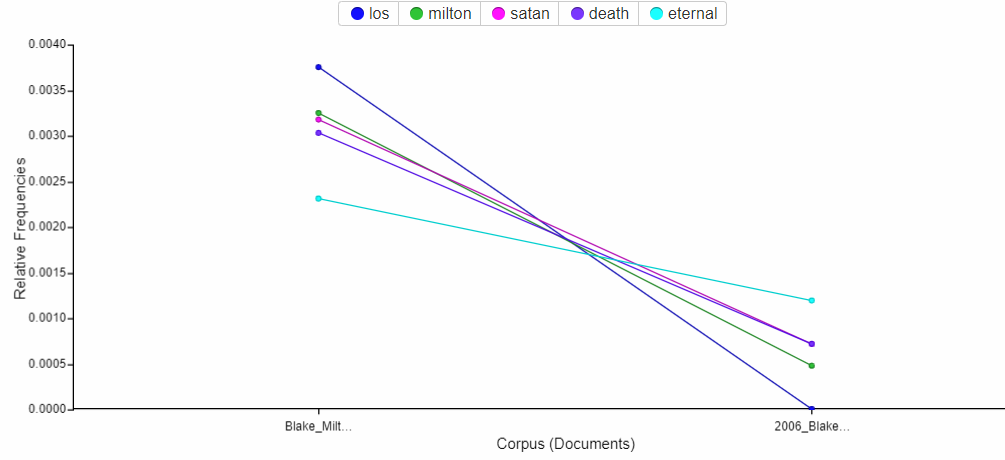
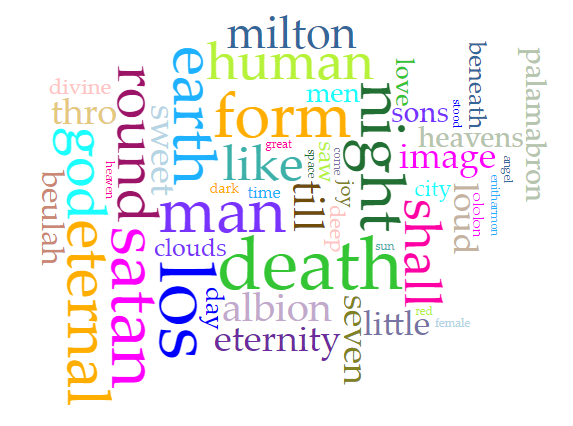
Since neither me nor my partner really knew anything about Blake, we learned a lot about him. We learned that Blake was a visual artist, who engraved his poems in illustrations, we also learned that Blake was a religious man but opposed all forms of organized religion. We saw Blake’s religious views through his poems mainly Milton, and The Marriage of Heaven and Hell, in which Blake discusses the relationship between man and God.

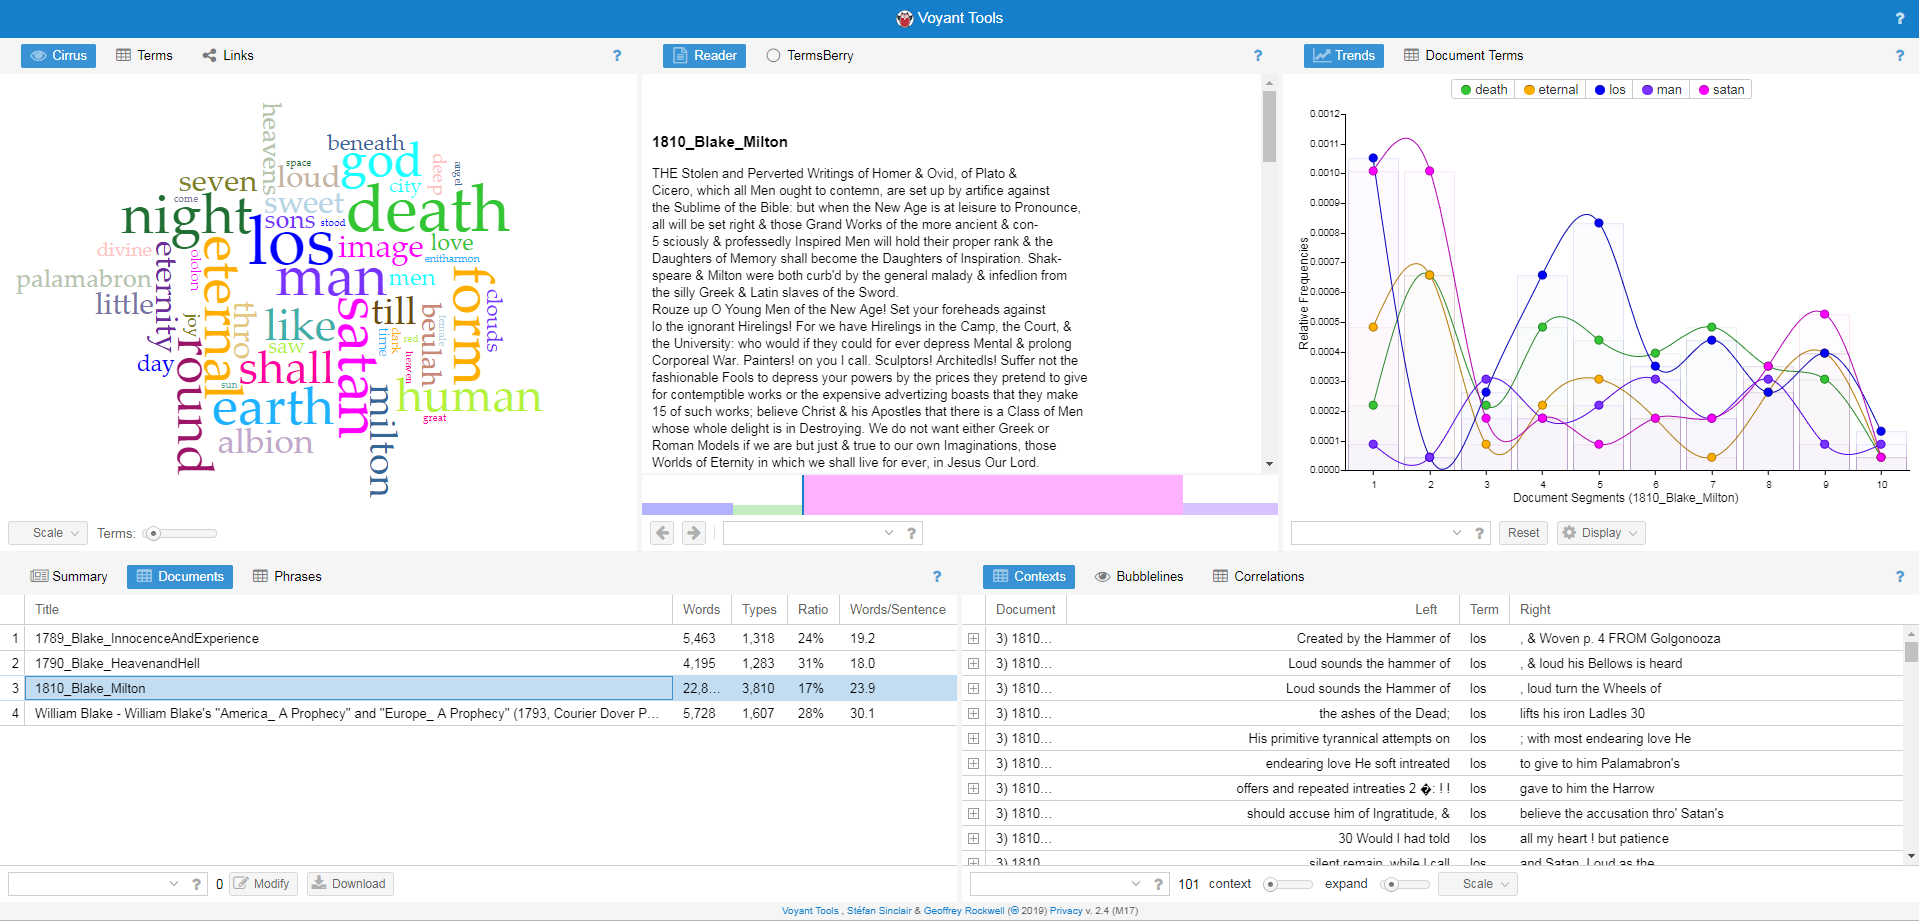
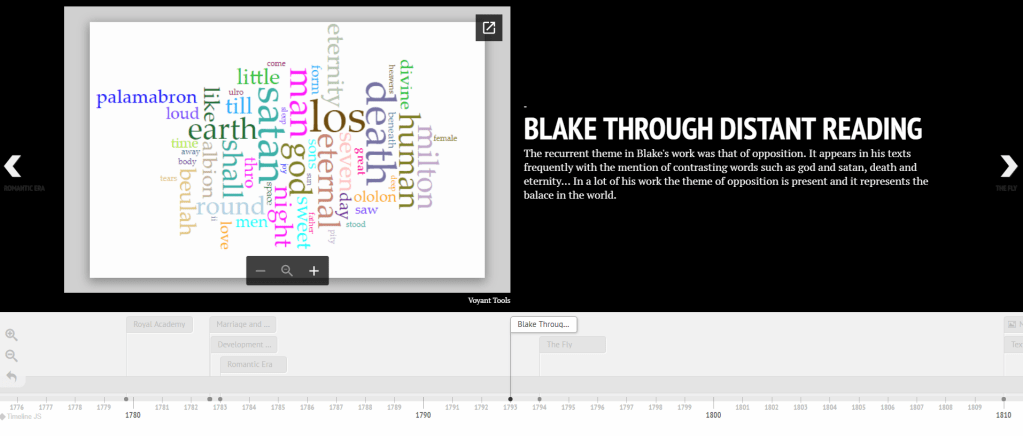
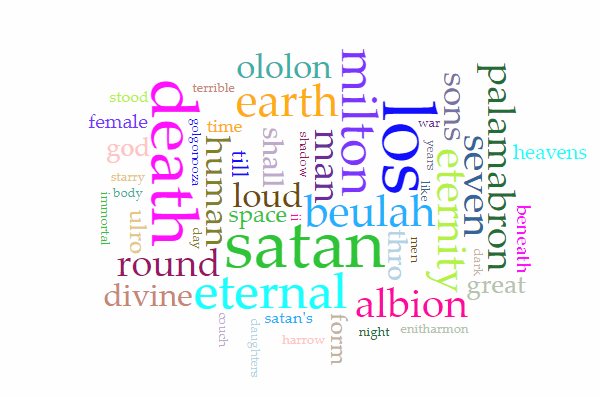
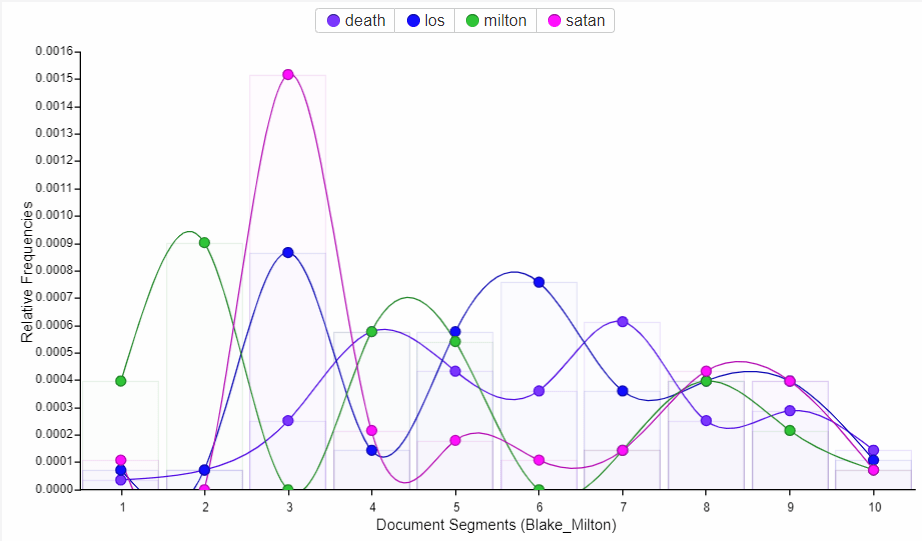
The digital tools we used helped us a lot with our findings. Voyant Tools was the most important to our project since through it we could explore the theme of Blake’s work by finding the most common words, their trends throughout the poems, and their context in different parts of the poems.

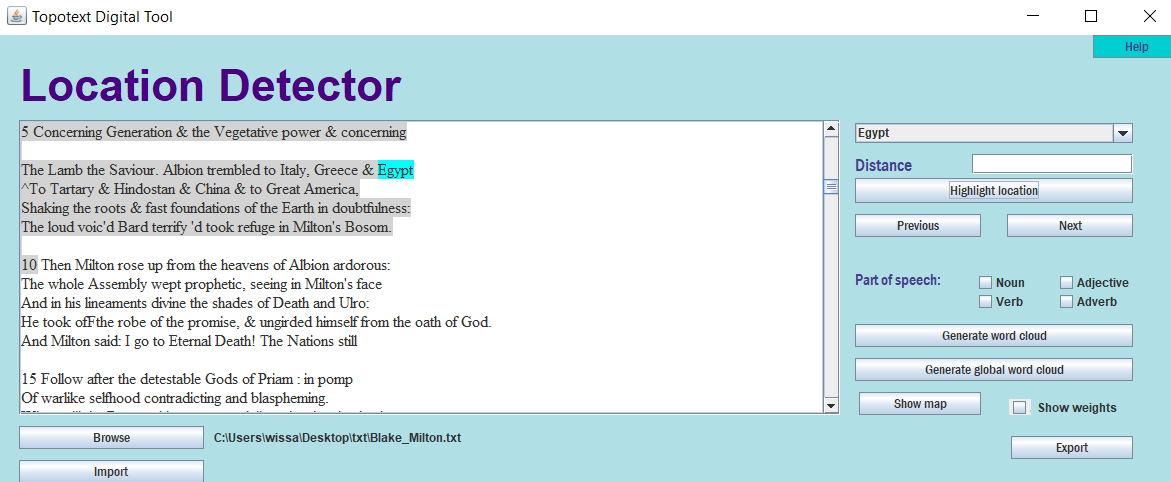
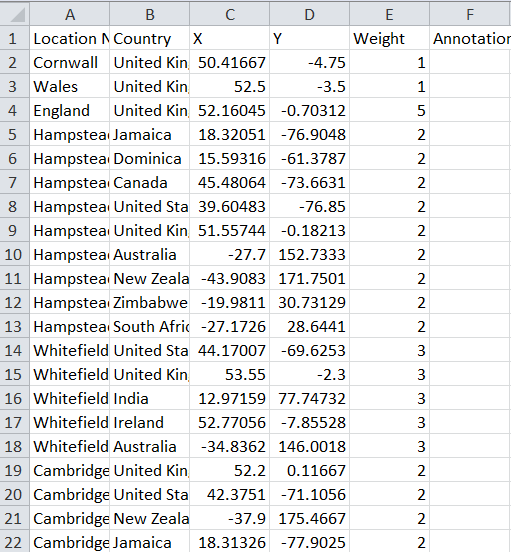
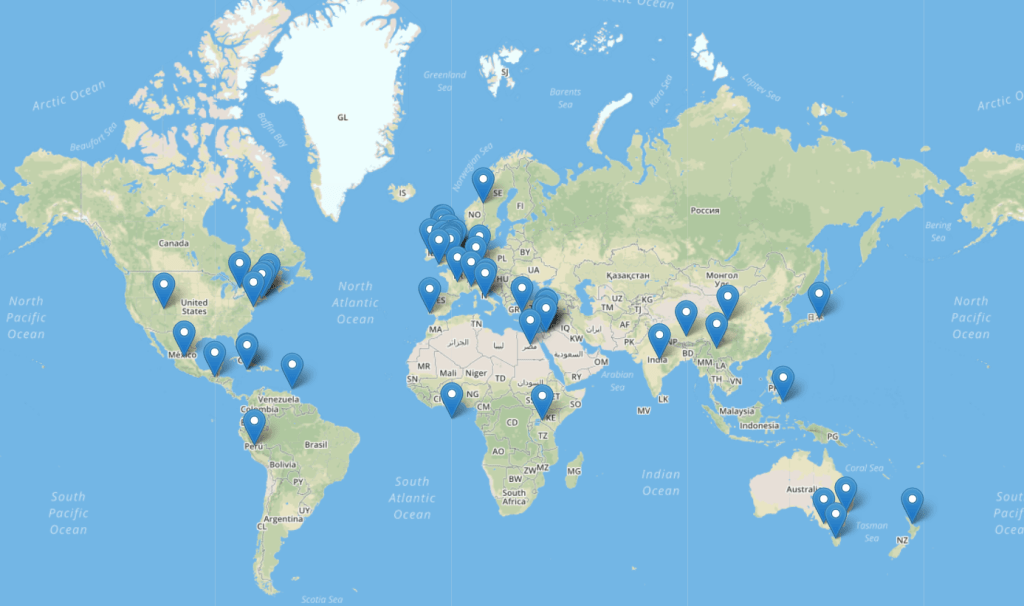
The mapping tools such as Topotext also helped us discover the many different places that Blake mentions in his writing, which shows us that Blake’s views on life were not centered only in London where he was born, but extended to all different parts of the world.

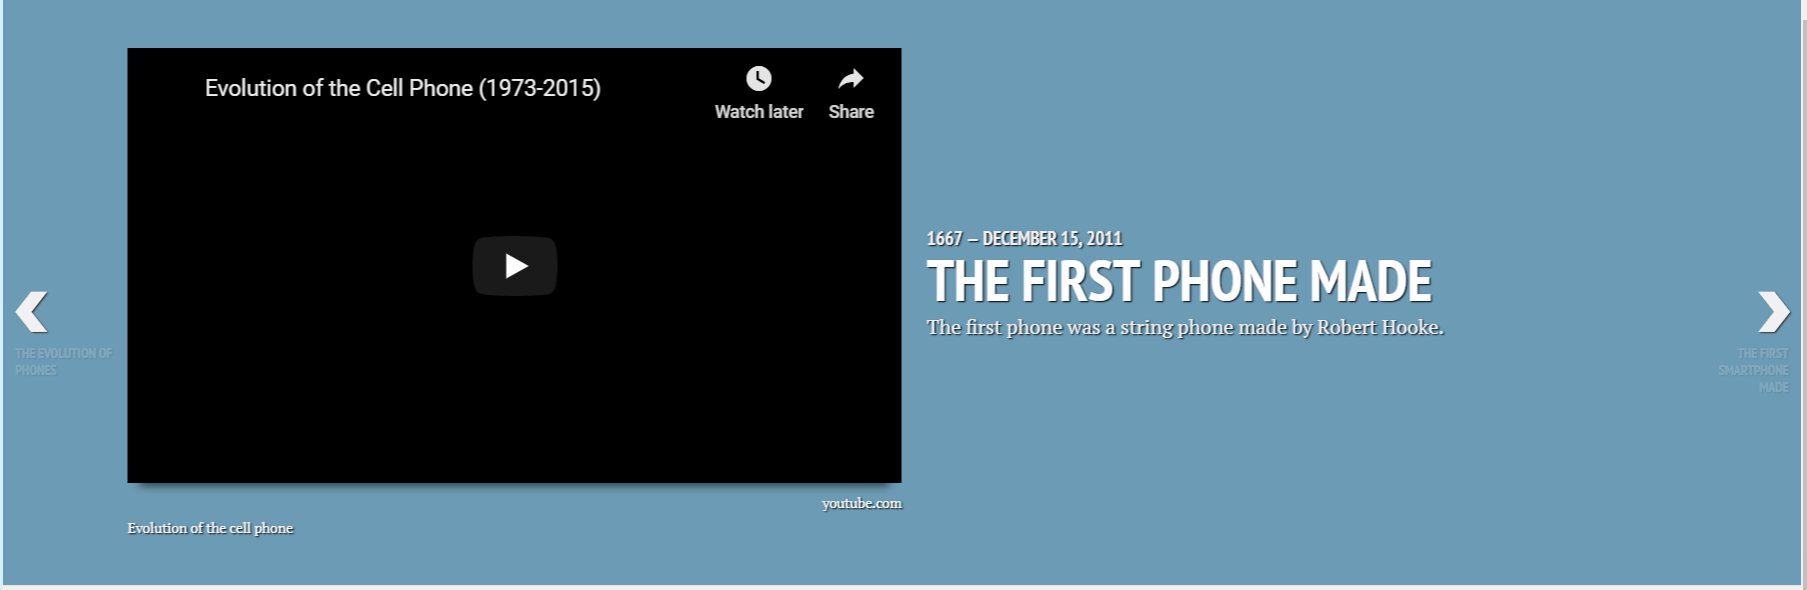
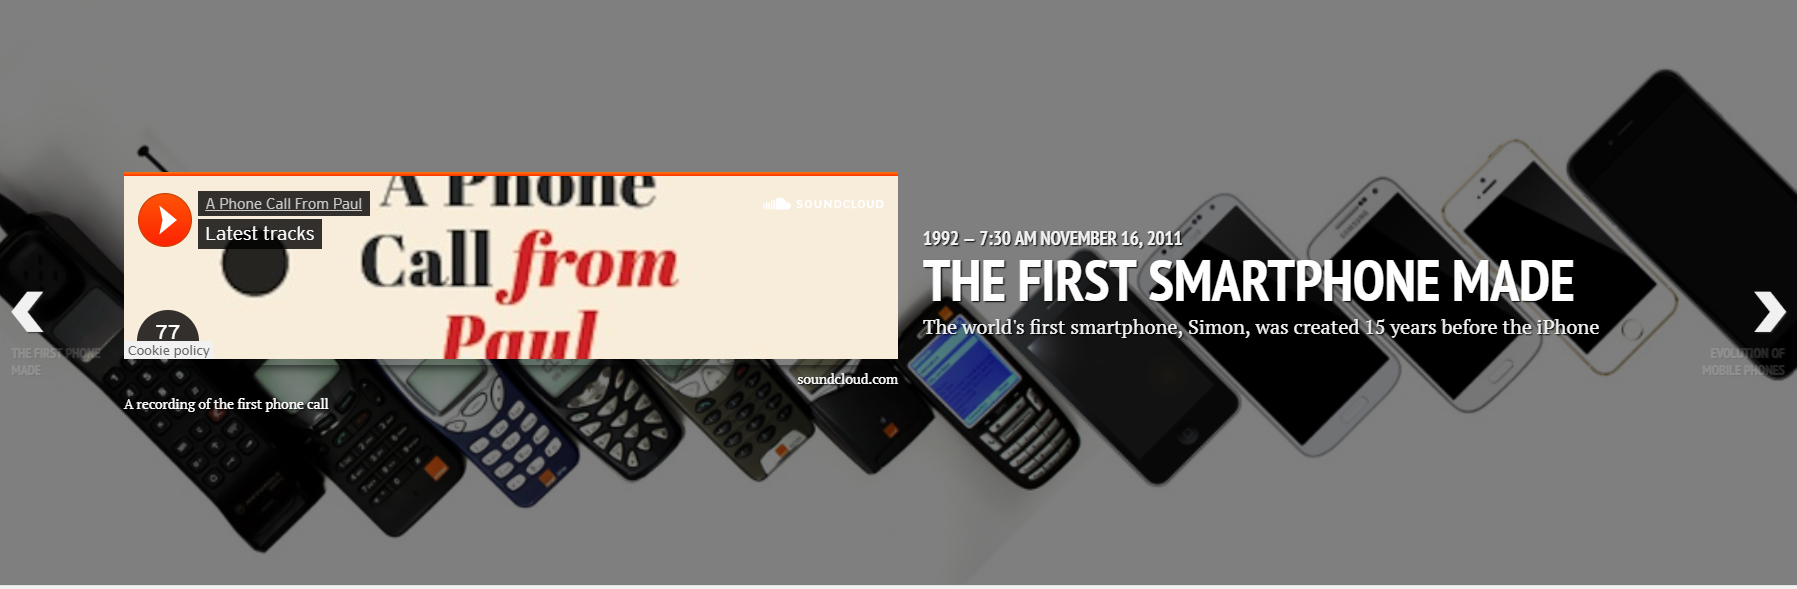
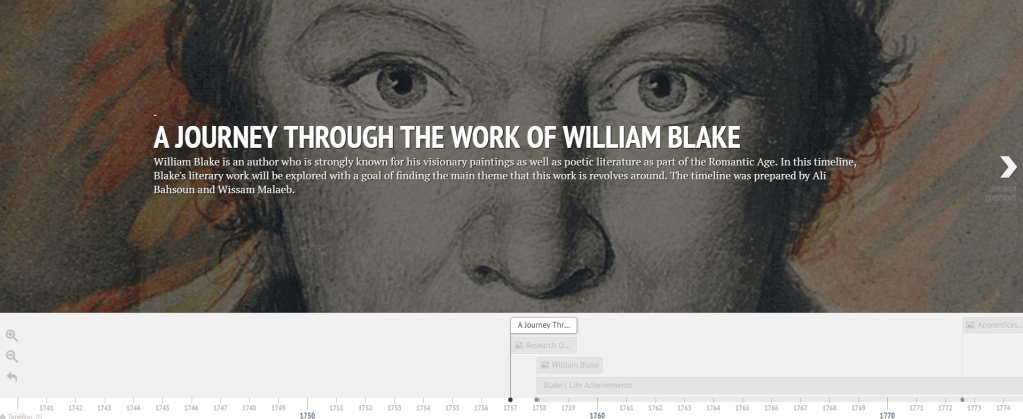
 TimelineJS provided us a unique platform to display and present our project. It helped us navigate through Blake’s life and peoms in chronological order, while being able to display some pictures, videos, maps & GIFS. In addition, it also allowed us to embed most of the tools used during the course to present our author and his work. Despite everything my partner and I didn’t present our work in the right order which may have confused both our class mates as well as our Respected professor in terms of our research criterion.

Working with those tools, although a bit complicated at first, was fun and interesting. They helped us in constructing a well-designed DH project which we are proud of and which we will certainly use as a guideline for future works in digital tools.

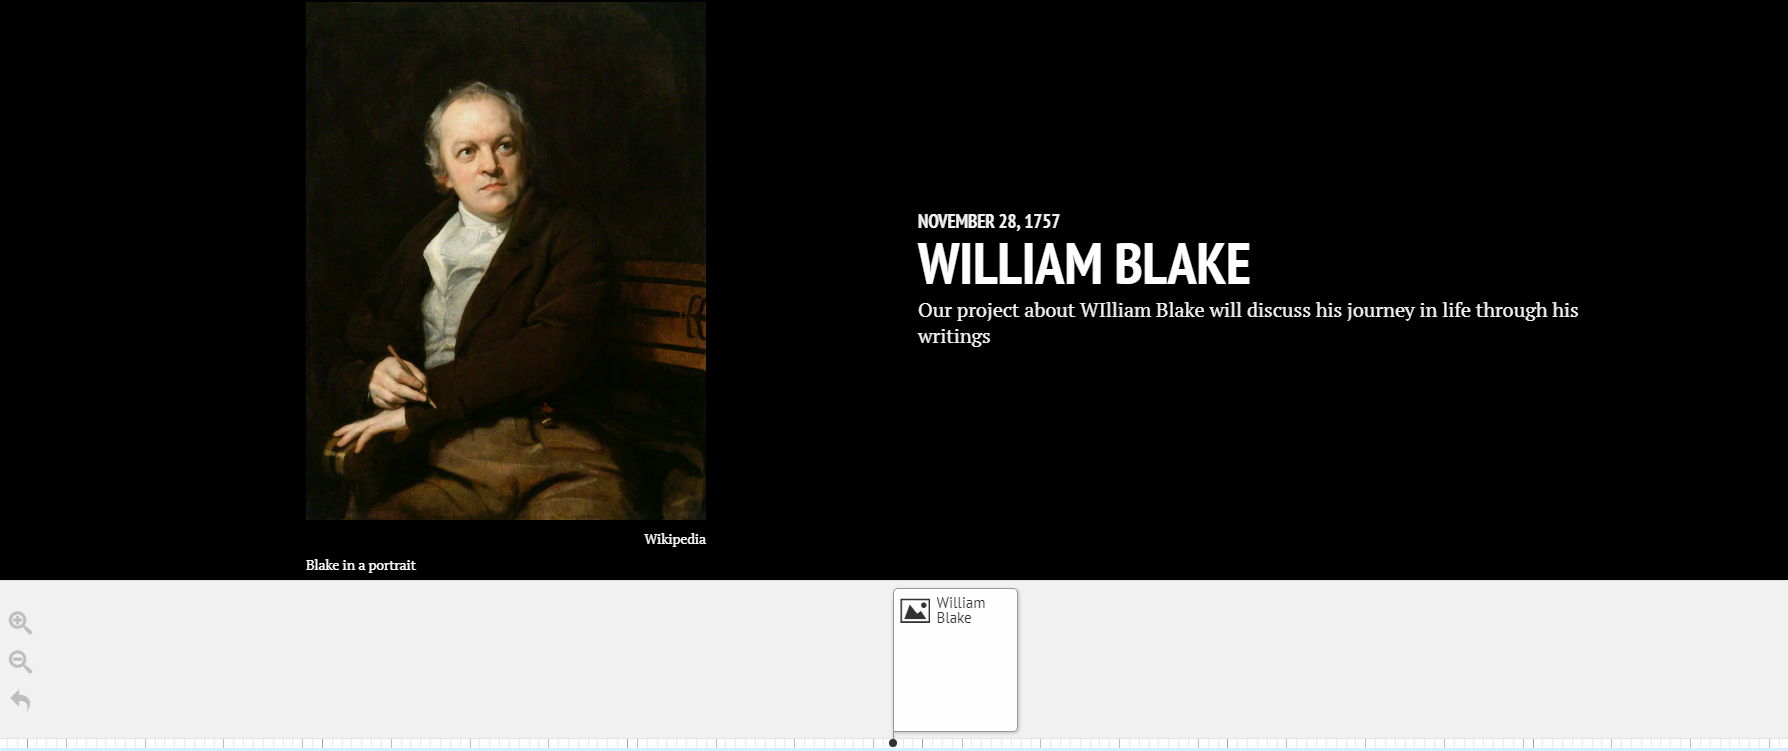
Here you can find our project timeline:

TimelineJS Project

Complexities of DH Tools

The ENG256B course, a course about digital humanities, opened my eyes to a new concept; digital humanities. I have always assumed that any English course would require old fashioned methods of analyzing texts, such as close reading hard copies of books and writing physical essays or reports n our analysis. However, this course showed me that text analysis can go as far as not having to read the actual text we are analyzing. And what I mean by that is that we can input our data or text into several digital tools that will make our analysis easier.

Throughout the semester, we were introduced to many digital humanities tools that helped us with our project. Most of these tools were easy to use, however some of them required extended guidance from our professor to learn how to properly interact with them.

As a start, I will talk about one of my favorite tools that me and my partner used for distant reading; Voyant Tools. Voyant Tools is a web-based application for text analysis. We employed this tool for distant reading of the poems of William Blake, who was the topic of our digital timeline project. Voyant Tools proved to be an efficient way to determine the central theme of the poems and give us a greater insight about them. Voyant tools had a nice feature, the cirrus, which showed the most frequent words appearing in a text or a group of texts. It also had a tool that graphed the trends in which these words appeared throughout the text or full corpus. These features were super helpful in our analysis of the condensed poems of William Blake.

However, Voyant Tools was not very user friendly. The service was slow to process multiple texts in our corpus and the cirrus would not update itself on the addition of new poems.

Other tools that we used for our project were the mapping tools Google My Maps and Topotext. For Google My Maps, we pinpointed significant locations in the author’s life and labelled them. We could add different layers to the map, each representing a different phase in the author’s life. To map the locations in one of Blake’s poems, we used Topotext which is a mapping tool developed by students who also studied at AUB. Topotext is a smart digital tool that gathers all the times any location was mentioned in a text and allows you to edit out any undesired or falsely collected locations. I didn’t encounter any difficulties when using either of these tools.

Using TimelineJS to implement our project was relatively easy. TimelineJS has predefined functionalities and only requires data input into prelabeled spreadsheet cells. TimelineJS allowed me and my partner to put together a creative and visually stimulating digital tmeline about Blake.However, it does not provide a lot of room for customization.

For our project we first had to find the data to analyze using the tools mentioned before. We were provided with links to several websites that contained sources that we could use. However, it was slightly hard to find texts and poems for out author since they were published in the 1800’s and digital copies of them were not always available. With some more searching around the web we were able to find enough texts for our analysis.

This course also required the use of Twitter. A task that I found a little bit difficult was finding relevant things to tweet about. Being a non-regular twitter user, I got to explore twitter more and experience a new side of social media. I am glad to say that twitter is now of more interest to me than it was before.

You can follow me on my twitter account below!

My Twitter Account

And lastly, the most enjoyable thing for me I feel was documenting my experience in this course by blogging about it on here. WordPress proved to be very user friendly, and made my first blogging experience worthwhile.

This course was unlike any other I took during my four years at AUB. It was very interesting to look at humanities from a digital perspective, and work with DH tools that introduced me to a new concept of distant reading. I encourage anyone considering to register this course to do it since it is both very interesting and rewarding.

Mapping Tools

Because Blake’s work involved mythical literature, you would assume that the locations occurring in his texts are fictional. However, Blake includes many countries and cities that exist in reality. In his book Milton, he mentions a lot of counties, some of which are China, Japan, Mexico, Peru, Ireland, Lebanon, Syria, and Egypt.

It seems that there is no specific connection between these places. A route linking them does not appear. And due to Blake’s poems being written in the 1870’s, they are quite difficult to understand with close reading.

What seemed interesting and quite a bit strange is that Blake included countries in his text such as Egypt, Jordan, Lebanon, and Syria.Blake mentions many locations, but does not focus on any specific one. All locations appear at the same frequency, once or twice.

When it came to using google maps, it was very interesting to know that you can pin point certain locations from the past and add a pin of different resemblance to it and by creating story gaps that link to one another through their different locations mimicking what a live tracker would do. In our work on mapping William Blake’s life through google maps we where able to create a map within a map of William’s life and the places he both studied and worked in. Since Blake is a poet from 19th century and from that period till this very day many buildings have changed, locations have been renamed and certain places even removed making it difficult to locate those places accurately.

For the literary text mapping we used Topotext which is a tool developed by AUB students that takes a text as input and generates a map with all the locations mentioned in the book marked.

Topotext Digital Tool

By clicking on export, we can generate an excel sheet that contains all the locations the author mentioned in the text. These locations are ordered alphabetically with each place having all its possibilities listed. For example, the city Cambridge appeared in the text, so the excel sheet contained seven different entries for Cambridge, each corresponding to a different location (Cambridge UK, Cambridge US, …). Our job was to clean this data so that the remaining rows were the correct locations of the text. The difficulty we encountered at this step was our uncertainty while determining which location was the correct one since the poem we were mapping was quite long and we could not read through it all.

Generated excel sheet of locations before cleaning

After cleaning the excel sheet, we imported it back to Topotext and then generated the map. We can add labels or annotations to each location including that in the annotation column of the excel sheet.

Map of locations appearing in text

One of the issues of Topotext was that it did not distinguish between character names such as Milton and locations such as Milton, Bolivia. It also took directions such as North and East, or the word ocean as locations in cities. Another disadvantage to mapping using Topotext is that any location mentioned in the text will appear in the data, so even if the character might not have visited that location it will still appear. We have to do a bit of close reading to determine if the locations on the map were just mentioned by the author or if the character in question actually went to them.

Disregarding these complications, Topotext is a smart mapping tool that can help us visualize a route the character might have taken in the text we are reading, or make relationships out of locations mentioned. For us, it was difficult to come up with an analysis regarding the relationship between the cities and countries mentioned, since they were a lot. Also, because the text is vague in terms of language this did not allow us to clearly understand the poem.

William Blake Through Voyant Tools

For our digital humanities project, my partner and I are studying the literary work of the William Blake, an author who is strongly known for his visionary paintings as well as poetic literature as part of the Romantic Age. We chose a few of his books to analyze with distant reading, which is an approach where a computer program processes big data and provides insight on the content of this data. We used Voyant Tools which is a web-based text reading and analysis environment for distant reading.

Our corpus is an anthology of books, poems, and other literary work done by the author William Blake. We included five texts in our corpus which are: Songs of Innocence and of Experience (1789), The Marriage of Heaven and Hell (1790), America a Prophecy (1793) , Europe a Prophecy (1794), and Milton (1810) . We got our texts from The Gutenberg Project and PDF drive.

Some of the research questions before we used Voyant Tools were related to Blake’s influence after he died and why his work was properly appreciated only after his death. After using VT, our research questions became centered on the theme in Blake’s work. Some of the questions are: What is the predominant theme in Blake’s work? How is the theme in his poems related to his artwork?

We started by uploading one of the texts, The Marriage of Heaven and Hell, we saw that the words god, man, men, and angel were used more frequently than others. We uploaded another text, America a Prophecy and Europe a Prophecy. In this text none of the frequent words were common with the frequent words of the first text, instead the words that appeared most frequently were form, image, night, auckland, and red. To observe the frequencies of these words we first looked at Cirrus and then the graph that illustrated the trends of these words throughout the text.

In his book, Milton, the word milton appeared 66 times while satan appeared 88 times and los appeared the most, 101 times. In Blake’s work, Los is the fallen form of one of the four zoas. The name Los is an anagram of the word Sol which is “sun” in Latin. It appears that Los, Milton and Satan were the predominant characters in this peom. The word god also appears a lot, 58 times, which has also been frequently found in his book The Marriage of Heaven and Hell.

Trends in Blake’s Milton

In the picture above we can see that when the word satan appeared the most, the word los also appeared the most. When we examined this section of the text, we found that in this part of the novel los and satan interacted the most.

Trends in Blake’s Milton and Marriage of Heaven and Hell

It appears that the word los does not appear in The Marriage of Heaven and Hell which shows us that the character los is not in the first book, but appears later in the other book Milton.

Blake seems to follow mythological themes related to heaven, hell, god, satan, and humans. We have discovered that Blake had a strong religious faith but opposed all forms of organised religion.

In Songs of Innocence and of Experience, the words little, night, love, joy, happy, and sweet appeared the most. This is a change in theme from death and hell as in the other books we mentioned before.

In general, our corpus had a central theme of god, man, satan, death, and eternity.

The most frequent words in our corpus

In his earlier works, such as Songs of Innocence and of Experience, the context was happy and cheerful, and the poems were not fictional. When he started his series of mythological writing the main theme was biblical prophecy expressing his personal and revolutionary beliefs.

Snapshot of Voyant Tools

Voyant Tools was not as user friendly as we had hoped. We had trouble uploading some of our texts and the software was slow to process changes in our input. For example, when we clicked on different texts, VT would not display them. Also, the graph would get altered or disappear completely at random times. Even though it was not very friendly and easy to use, VT has useful features for our project, and helped us a lot with our distant reading.

Distant reading through Voyant Tools proved to be very beneficial and gave us a general comprehension of Blake’s ongoing themes that occurred in his work without us having to read them closely. It also helped us acquire an understanding of Blake’s intention in his writings.

Interacting with TimelineJS

Throughout this month in our digital humanities course, we have learned many new things following each session taken with the professor. In the first week we got introduced to WordPress (which you are reading this blog on), an open source management site in which you create your own content and shape all contents combined into a personal/public blog available to the masses.

During last week’s session we were introduced to TimelineJS. Now you might be thinking “What is TimelineJS?” and your question will be answered shortly. In the past, information was collected from different places and added together in the form of a book, novel, bibliography… However what TimelineJS does is that it allows you to collect all the information you have acquired and put them into a visually stimulating timeline.

After looking into all authors, my partner and I decided to go with William Blake, an author who is strongly known for his visionary paintings as well as his poetic literature as part of the Romantic Age. The reason we chose to go with William Blake is because he was in an era where artists reacted to changes that occurred in the European side through the industrial revolution, which was one of the greatest revolutions in English history, and marked a change of how people envisioned things and how creations went from households to factories and mass production plants. What is unique about Blake is that his strong faith and religious views made him see the beauty that god has blessed his surroundings with. Blake’s history is very unique and endless that using TimelineJS to organize his artistic and literary journey made our project a lot easier and entertaining to work with, especially that it also changes the mainstreams of PowerPoint and Prezi.

TimelineJS turned out to be very user friendly. To generate an eye-catching, interactive timeline, all you have to do is enter the information you have into a Google spreadsheet template which is split into pre-labeled columns. Each column in the spreadsheet defines where your data should go. What’s nice about this tool is that it is easy to use for everyone and requires very little or no previous knowledge of TimelineJS at all.

Spreadsheet used for timeline about the evolution of phones

As you can see in the image above, the cells under the headline column contain information about the headline of each piece included in the timeline. You can also add media under the media column such as images, gifs, tweets, SoundCloud tracks … Using TimelineJS to create a digital timeline was overall a smooth process.

Title page of timeline about innovation in cars
Timeline entry with YouTube video and blue background
Timeline entry with SoundCloud track and custom background image

TimelineJS gives us the freedom to include images, GIFs and even videos found about William from drawings to video autobiographies found on the net. The option of including map locations is perfect for us since we are going to be mapping the author’s life and assessing the different locations of his work and paintings which are now located in different parts of the world and inspire youth artists and poets. With TimelineJS we can easily integrate different forms of multimedia that are relevant to our research. You can see in the pictures above how neat and organized the entries of the timeline are, with each one being customizable with respect to the information included in it.

Youtube videos and SoundCloud tracks help us by providing information that isn’t in the form of text. Nowadays people prefer to watch or listen to information rather than read it, so what makes TimelineJS fun is the fact that the audience isn’t only learning new information but is also visualizing it in the form of different media.

This course requires us to study the life, literary achievements, and literary texts of an English author and identify the relationships between events related to them. TimelineJS would make our job easier by organizing our information chronologically, taking the audience step by step through the life of William Blake whom we chose to discuss in the timeline. It will allow us to write and see this author in different times of his life as if we are with him on his journey instead of writing about his life in an essay or bibliography.

Introductory slide of our project on William Blake

TimelineJS is an extremely easy digital tool to use as it contains helpful features. Without it our project would be difficult to accomplish, and would not end up being as attractive to the reader as TimelineJS will make it. This new tool opens doors of creativity, easy organization and presentable work that would interest our audience rather than bore them with every next slide on a PowerPoint or Prezi document.

My Digital Narrative

My earliest encounter with the digital world was when I was 6 and me and my older sister would use my dad’s laptop to play multiplayer games on. Back then, my dad would set up everything for us and we would play Jazz Jackrabbit 2. My interaction with the laptop was just pressing a few keys to move my player. However, at 11 years old, my dad extended my knowledge on how to use the computer to play games on, and to become familiar with some Microsoft Office applications. Since then, I have found a love for digital devices and I think that this steered me into the path of choosing to major in computer and communications engineering.

A big portion of my childhood was spent playing games on different consoles. I still remember the day my uncle surprised me with a PS one and several CD’s with different games to play. My favorite game to play was, and still is, the FIFA video game. My parents ended up getting us a PS2 a few years later.

My First Phone

At 15, I got my first phone which was the Nokia Asha 303. My second phone was an LG optimus that had a 3D camera (which I found really cool but never ended up using). My third phone was a Samsung Note 3 Neo which I really liked and that led me to get my current phone which is the Samsung Note 5.

My second phone was an LG optimus that had a 3D camera (which I found really cool but never ended up using). My third phone was a Samsung Note 3 Neo which I really liked and that led me to get my current phone which is the Samsung Note 5.

At first, the primary use of my phone was to contact my parents if I was out. However, as I got older I used my phone to chat with my friends and explore social media platforms. If I had to choose only one digital device to use, it would definitely be a smartphone.

When I started studying at AUB, I got a Lenovo laptop that is now indispensable to me since I use it pretty much for everything from doing university assignments to gaming (I still prefer my phone over it though).

As I mentioned before, I use my phone to browse social media platforms which include Instagram, Facebook, Snapchat, and recently Twitter. Instagram consumes most of my time since looking at pictures is very effortless and before you know it you’d have spent hours looking at post after post. I use Facebook the least, since I do not find it very user friendly, and also because it does not interest me or entertain me.

Other than social media platforms, I use several digital applications, one of them being an application called Power Planner that manages my tasks and helps me become more productive. I also use Youtube a lot in my free time as a replacement for TV. I also use several digital applications to code and develop other digital application.

Being a CCE student the word data to me is linked to digital information used by digital devices. I encounter data everyday; when I study, when I code, when I communicate with others, when I use social media platforms…

I have yet to learn about the intersection of computing and humanities, but this is of interest to me since I study computer engineering. I am excited to get into digital humanities, and I hope that my journey will be smooth and fruitful!